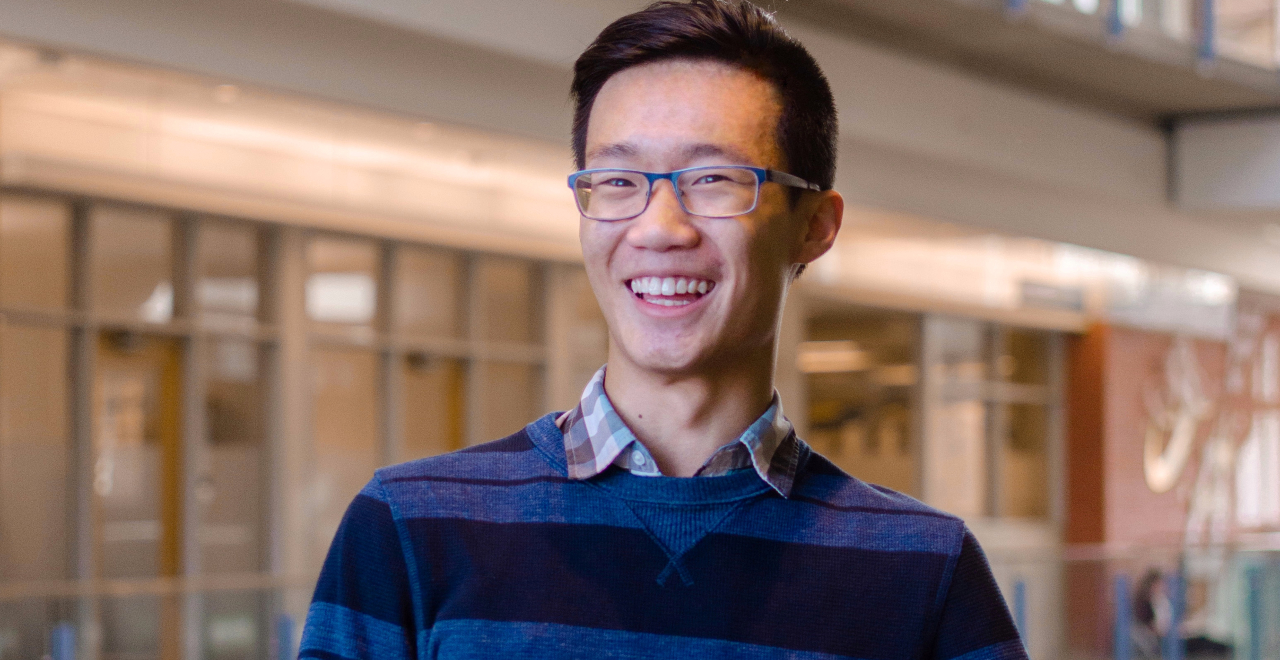
A University of Alberta neuroscience student and his University of Calgary colleagues have developed an online tool that predicts how the demographics of a region will affect the spread of COVID-19, and may yet join in the local effort to flatten the curve.
Eddie Guo, along with friends Sunand Kannappan and Mehul Gupta, developed the interactive application that visualizes the effects of age, poverty, income and population density on the spread of COVID-19 as part of a month-long data science hackathon hosted by Alberta Innovates, Cybera and the Pacific Institute for Mathematical Sciences.
The trio won $500 after winning the hackathon's Post-Secondary Student Award.
"But more importantly, because it was hosted by Alberta Innovates, we knew that what we created could potentially have an impact on policy decisions because Alberta Innovates is a major player in the fight against COVID-19," said Guo, who will be entering his third undergraduate year as an engineering student this September.
He said the goal of the hackathon was simple: collect and curate worldwide open data and refine, transform and link that data to provide a visualization of the impact of COVID-19.
Two themes for the participating teams to consider were an overall understanding of the efforts to flatten the curve and economic recovery, especially for Alberta and Canada.
After going back and forth, Guo said, he and his teammates decided to break from anything predefined with assumptions and went with a concept that was agnostic to show the amount of people in a jurisdiction who would be infected given their parameters.
"We didn't really see a tool out there that was specific to any particular person, or region where they live," he said. "We thought it would be valuable because people can see the impact of COVID-19 or at least get a more intuitive idea of how it spreads within their particular region, rather than something bigger like a country."
In choosing the parameters, Guo said after scouring COVID-19 studies, he and his team came to the conclusion that the number of people per square mile, or population density; median income; proportion of relative poverty in their region; and percentage of the population over 65 were the most telling factors for their analysis.
"We're basically just taking data from open-source databases and feeding it into the model that predicts for you the number of cases of COVID-19 as well as the number of deaths in an area," he said. "You can make it as granular as you want and it's only limited by the amount of information you have per region."
Guo said the tool will not only help policy-makers and the public visualize the spread of COVID-19, but perhaps help them predict the spread of the virus and plan accordingly.
"That way, policy-makers can prepare for when the load of the virus is the greatest on society-when we'll need the most respirators, for example," he said.
Guo said he would also like to introduce the application to students at Youreka Canada, a volunteer organization where he met his teammates.
He explained Youreka Canada is a citizen science think tank that partners with high schools and post-secondary institutions across Canada-including the U of A-to give students opportunities to get involved in higher-level scientific inquiry. Students enrolled in the program work with real clinical data as well as a host of programs and software used in a research setting to complete a health science project.
"We want to show the students in the program what we did, our motivation, and how we did the research," said Guo, who is the associate director of programs at the organization. "What we want is for the students at the different chapters across Canada within our program to work on the different sets of data and combine them all into one super-project."
